
Why Existing Salesforce Teams Integrations Fall Short
October 13, 2025 5")
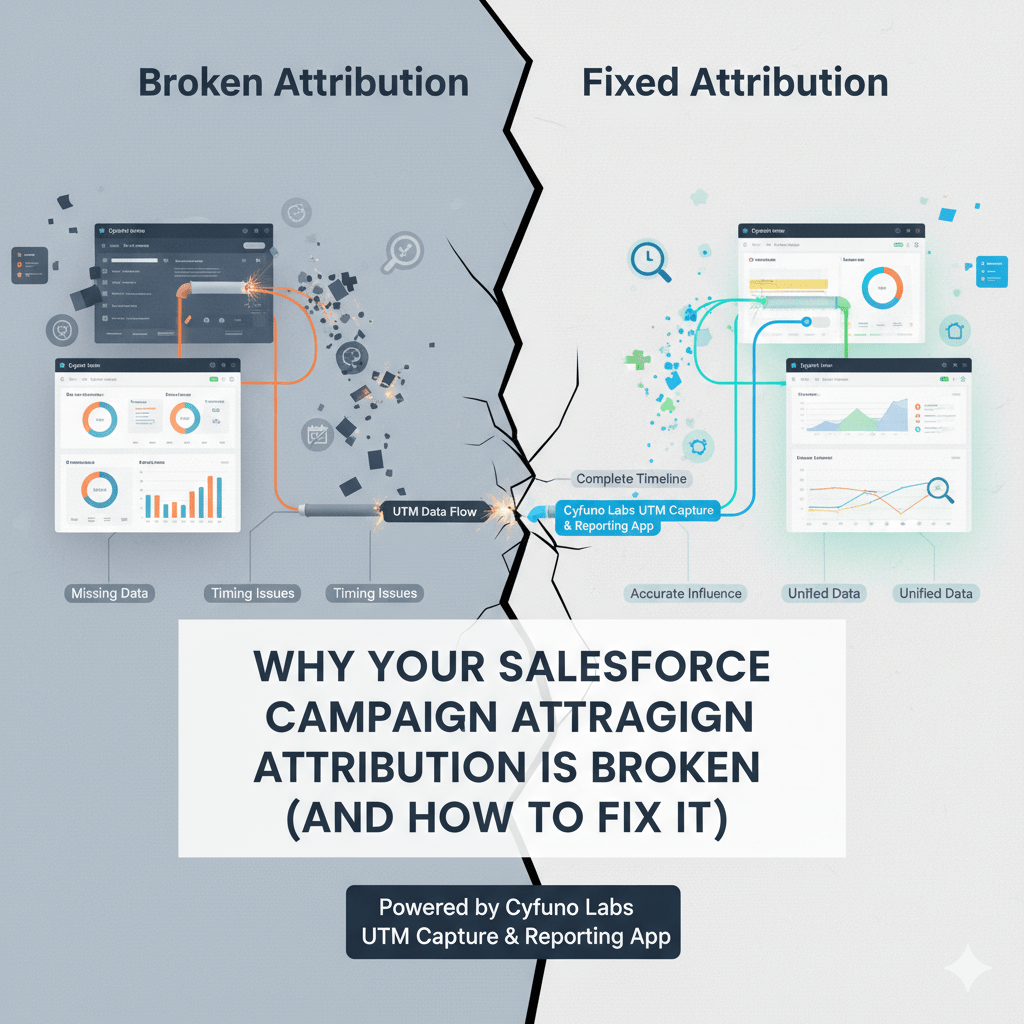
Why Your Salesforce Campaign Attribution is Broken (and How to Fix It)
November 9, 2025
Campaign Influence Reporting in Salesforce: 7 Metrics You Should Track
Most marketers know their campaigns are working, it's just hard to prove how well inside Salesforce.
Campaign Influence Reporting is supposed to fix that. It connects the dots between your marketing campaigns and the opportunities they help create. But most orgs barely scratch the surface, settling for a single “Primary Campaign Source” field or the out-of-the-box Influence Model that never really tells the full story.
Let’s fix that.
Here are 7 Campaign Influence metrics that will actually help you understand what’s working, what’s not, and how to make smarter marketing decisions.
Why Campaign Influence Reporting Matters
When it’s set up right, Campaign Influence gives marketing and sales a shared language. It links effort (campaigns) to outcome (pipeline).
The problem is, most orgs only see a sliver of the picture. They tend to know where leads came from... but not what campaigns nudged those deals along the way.
Influence reporting bridges that gap. It turns marketing activity into something measurable, trackable, and ultimately, actionable.
The seven metrics below are where you start seeing that shift happen.
1. Number of Influenced Opportunities
What it shows: How many opportunities had at least one related campaign member.
This metric tells you whether marketing is showing up early and often in the pipeline.
If you see that most opportunities have zero campaign influence records, that’s not because marketing wasn’t involved, it’s because your data capture is incomplete. Start there.
Once your tracking is clean, the trend line for “Influenced Opportunities” becomes your marketing team’s health check. A rising line means campaigns are consistently engaging contacts who eventually buy.
Pro Tip: Filter this metric by Opportunity Stage to see how influence changes between pipeline and closed-won deals.
2. Average Opportunity Value Influenced per Campaign
What it shows: The average revenue potential per campaign.
Some campaigns don’t generate a ton of influenced deals... but when they do, those deals are huge.
Looking at the value influenced per campaign helps you identify which efforts are touching your highest-value pipeline.
A $10K event that consistently influences $1M in pipeline isn’t an expense, it’s a revenue lever.
Pro Tip: Pair this with campaign cost to calculate ROI or cost-per-influenced-dollar.
3. Average Number of Campaign Touches per Opportunity
What it shows: How many marketing interactions typically happen before a deal closes.
This metric gives you a clear view of the buyer journey. Not what should happen, but what does happen.
For B2B companies, the number of touches is usually higher. Complex buying committees, longer sales cycles, and multiple stakeholders mean it can take anywhere from 6–12 campaign touches (sometimes more) before a deal is influenced to close. Those touches might include webinars, email nurtures, event attendance, or targeted ads.
For B2C organizations, the journey is typically shorter and more direct — maybe 1–3 touches before conversion. You’re looking at simpler decision paths, where timing and emotional triggers often matter more than nurturing.
Why it matters: Seeing the real number of touches helps you calibrate your marketing mix. Too few touches might mean leads aren’t being nurtured; too many could signal oversaturation, overlapping campaigns, or over-eager attribution.
Pro Tip: Use this metric alongside Campaign Type to spot where your influence efforts are most efficient — for example, events might require fewer touches than digital ads but deliver higher-quality engagement.
4. Time Between First and Last Touch
What it shows: The duration of marketing influence on a deal.
This is your nurture cycle, in data form.
A short window between first and last touch could mean fast decision cycles or transactional sales. A longer window often signals complex B2B buying journeys.
Why it matters: Understanding this helps you time campaigns more effectively, nurturing leads when they’re most likely to engage and not oversaturating early.
Pro Tip: Compare across products or business units to spot big differences in buying behavior.
💡 Try This: Download the Campaign Influence Accelerator. It gives you pre-built dashboards that visualize model comparisons side-by-side so you can spot insights instantly.
5. Influence Model Comparison
What it shows: How attribution changes depending on the model you use.
Salesforce gives you multiple influence models: First Touch, Last Touch, Even Distribution, and any custom models you create.
Looking at the same data through each lens reveals just how much the story can change.
-
First Touch credits awareness campaigns
-
Last Touch credits bottom-of-funnel pushes
-
Even Touch gives everyone equal credit
-
Custom models let you assign weight based on what you believe drives conversion
If you’re serious about understanding marketing impact, you need to look at all of them.
6. Campaign Influence by Channel or Campaign Type
What it shows: Which types of campaigns drive the most influenced pipeline.
Break down influence by campaign type (Webinar, Email, Paid Media, Event, etc.) or channel.
You’ll quickly see where your pipeline really comes from, and where it doesn’t.
If your webinars consistently show up in influenced opportunities but your paid search campaigns don’t, it’s a signal to shift budget.
Why it matters: This turns reporting from “look at this pretty dashboard” into “here’s how we spend smarter next quarter.”
7. Uninfluenced Opportunities (and Why They Matter)
What it shows: Deals without any related campaign influence.
At first glance, it looks like these are sales-only wins. In reality, they’re often data gaps. (There are tools that help here)
Maybe campaign member associations weren’t added. Maybe the contact roles weren’t linked to opportunities.
Either way, this metric surfaces where your influence tracking breaks down.
Why it matters: Because “uninfluenced” doesn’t mean “un-influenced.” It usually means your data isn’t capturing the full picture.
Bringing It All Together
When you track these seven metrics consistently, your Campaign Influence reporting stops being a vanity exercise and starts driving decisions.
You’ll see:
-
Where marketing actually moves revenue
-
Which channels build meaningful pipeline
-
How long it takes your campaigns to make an impact
-
Where your attribution data still needs cleanup
The goal isn’t to “prove marketing’s worth.” It’s to understand how marketing and sales work together to drive growth.
Start by setting up clean campaign member data. Then install the Campaign Influence Accelerator. It’s free, and you’ll be looking at real influence insights within minutes.
 8")

